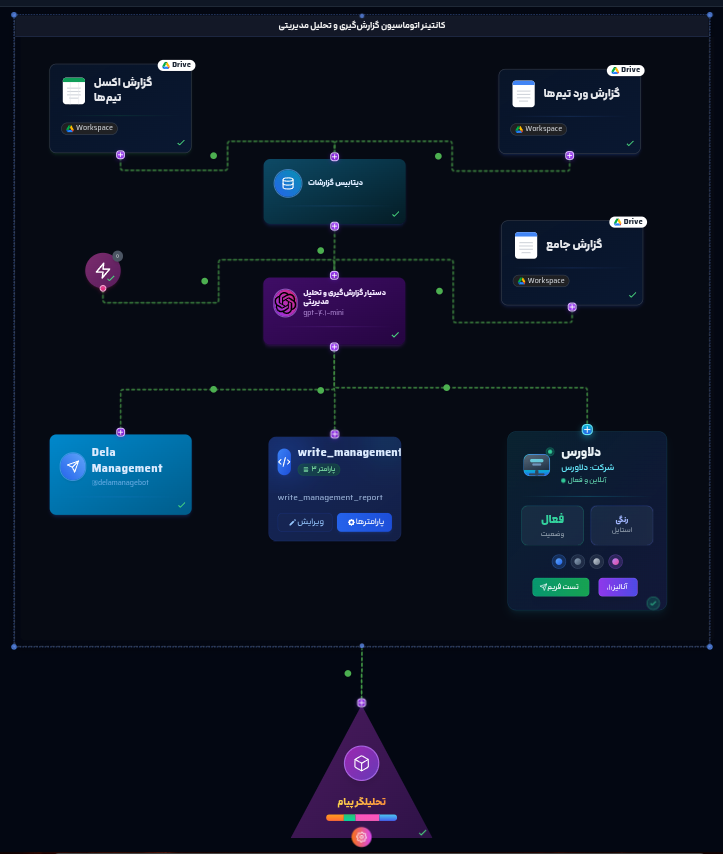
Build intelligent automated management reporting workflows that collect performance data from multiple sources, generate comprehensive analytical reports with key metrics and trends, and deliver periodic insights to executives and managers with AI-powered analytics.
Target Audiences
CEOs
Receive comprehensive reports for strategic decision-making
Mid-Level Managers
Monitor team performance and identify issues effectively
Operational Teams
Enhance coordination and improve processes
Finance and Marketing Teams
Analyze specialized data and optimize performance
Development Teams
Integrate with organizational data systems
Prerequisites
Access to a Delaverse account
Performance data (e.g., sales reports, expenses, marketing KPIs) ready for upload
Google account access for Google Sheets and Google Docs Nodes
Access to Telegram with a bot token for the Telegram Node
Step 1: Create a New Project
Log in to Delaverse: Visit playground.delaverse.ai and sign into your Delaverse account
Select New Project: On the projects dashboard, click the New Project box
Name the Project: Enter a title, e.g., Automated Management Reporting and Analysis, in the Project Name field and click Create Project
Enter the Playground: You'll be directed to the project's Playground, where you can add nodes
Step 2: Add Performance Data Input Nodes
To generate management reports, data is collected from multiple sources: Google Sheets, File Database, and Google Docs.
2.1. Google Sheets Node
Uploads tabular performance data (e.g., team reports)
1
Add Node: From the right-hand menu, click Google Sheets Node
2
Configure Node: Click the node and enter a title, e.g., دادههای عملکرد (Performance Data)
3
Sign in with your Google account and create a new sheet
4
Enter data (e.g., KPIs, sales, expenses)
5
Click Update
6
Save Changes: Click Save Changes and close the editor with the top-left X button
Suggested Content:
Marketing Table: Columns for date (e.g., 1404/03/01), campaign (e.g., Google Ads), cost (e.g., 10M IRR), clicks (e.g., 5,000), conversion rate (e.g., 2%)
Financial Table: Columns for date, transaction type (revenue/expense), category (e.g., sales, payroll), amount
Operational Table: Columns for date, project (e.g., product development), status (in progress), progress percentage (e.g., 70%)
2.2. File Database Node
Uploads data files (e.g., CSV or PDF reports)
1
Add Node: From the right-hand menu, click File Database Node
2
Configure Node: Click the node and enter a title, e.g., فایلهای گزارش (Report Files)
3
Upload files (e.g., CSV sales data, PDF team reports)
4
Review the list of uploaded files
5
Save Changes: Click Save Changes and close the editor with the top-left X button
Suggested Content:
CSV: Sales reports with columns for date, product, quantity, revenue
Add Node: From the right-hand menu, click Google Docs Node
2
Configure Node: Click the node and enter a title, e.g., گزارشهای متنی (Text Reports)
3
Sign in with your Google account and create a new document
4
Click Update
5
Save Changes: Click Save Changes and close the editor with the top-left X button
Suggested Content:
Financial team text report: Analysis of revenues and expenses
Reporting guidelines: Key metrics required by the CEO (e.g., campaign ROI)
Step 3: Connect to the Vector Database Node
Add Node:Step 3: Connect to the Vector Database Node
Configure Node: Click the node and enter a title, e.g., تحلیل گزارشها (Report Analytics)
Connect Nodes: Connect the outputs of the Google Sheets, File Database, and Google Docs Nodes to the input of the Node
Verify Data: Click the node to ensure data is correctly aggregated
Save Changes: Click Save Changes and close the editor with the top-left X button
Step 4: Add the AI Assistant Node
This node analyzes data and generates summary and analytical reports:
Add Node: From the right-hand menu, click Analyzer Node
Configure Node: Click the node and enter a title, e.g., تحلیل گزارشها (Report Analytics)
Select AI Model: Select an AI model (e.g., Open AI)
Instructions: Choose the Automated Reporting template or edit the instruction (see below)
Connect Node: Connect the output of the Vector Database Node to the input of the AI Assistant Node
Save Changes: Click Save Changes and close the editor with the top-left X button
Automated Reporting Instruction Template
You are an AI assistant for automating reporting and managerial analysis. Your goal is to analyze performance data from various sources and generate concise, analytical reports for managers.
- Retrieve Excel reports from Google Sheets with the following IDs: {your google sheets IDs}
- Retrieve text reports from Google Docs with the following IDs: {your google docs IDs}
- Store the data in a vector database.
- Perform the following analyses:
  - Key Metrics: KPIs for each team (e.g., revenue, campaign ROI, project progress percentage).
  - Trends: Changes in metrics over time periods (e.g., 10% sales growth).
  - Issues: Identify bottlenecks (e.g., reduced conversion rates or project delays).
  - Suggestions: Recommendations for improvement (e.g., increasing advertising budget or prioritizing projects).

Critical Function Call Requirements: After providing your analysis, you must immediately call the function {your function’s name} with the full analysis text as the content parameter. Do not call the function with empty parameters like {}.

Mandatory Steps:
1. First: Provide your complete analysis response in Persian.
2. Then: Immediately call the function {your function’s name} with the same full analysis text as the content parameter. Call the function with the following values:

   {
     "doc_id": "your doc id",
     "content": content
   }
The content parameter must be the complete analysis in Markdown format, not empty or summarized, but the full text.

Reminder: The function call is mandatory and must include your complete analysis as the content.
Important: Ensure the analysis result is sent to Telegram in its entirety.
Step 5: Deliver Reports
Users can receive reports via Telegram, Google Sheets, or Google Docs.
5.1. Telegram Node (Optional)
To deliver reports via Telegram:
Create a Telegram Bot:
• In Telegram, go to @BotFather, send /start, then /newbot• Choose a name, e.g., @ReportBot, and copy the bot token
Configure Telegram Node:
• Add Node: From the right-hand menu, click Telegram Node• Enter the bot token and click Test Connection• Configure Advanced Settings (Welcome Message, Group Access, etc.)
Advanced Settings: Welcome Message: سلام! آماده گزارش عملکرد هستید؟ (Hello! Ready for performance reports? 😊). Set Group Access, Access Restriction to All, Message Limit to 10 messages per minute.
5.2. Google Sheets Node (Optional)
To store reports in a table:
Add Google Sheets Node:
• From the right-hand menu, click Google Sheets Node• Enter title, e.g., گزارش مدیریتی (Management Report)• Sign in and create new sheet with columns: date, team, metric, value, and trend
Add Function Call Node:
• From the right-hand menu, click Function Call Node.• Then click the node, enter a title, and press the Parameters button.• For non-technical users: Select the "Write to Google Sheets" template to auto-configure parameters.• In the generated JSON schema, make sure the "name" parameter matches your preferred function name.• Copy your Google Sheet’s ID from the *Google Sheets Node* and paste it into the section marked your_sheet_id in the JSON schema.• For technical users: Click "Build with AI", write your custom instructions in Persian, and click "Build Smart Parameters".
5.3. Google Docs Node (Optional)
To store reports as text:
Add Google Docs Node:
• From the right-hand menu, click Google Docs Node• Enter title, e.g., گزارش متنی مدیریتی (Management Text Report)• Sign in and create new document for report content
Add Function Call Node:
• From the right-hand menu, click Function Call Node.• Then click the node, enter a title, and click the Parameters button.• For non-technical users: Select the "Write to Google Docs" template to auto-configure parameters.• In the generated JSON schema, set the "name" parameter to match your preferred function name.• Copy the Google Doc’s ID from the *Google Docs Node* and paste it into the section marked google_doc_id in the JSON schema.• For technical users: Click "Build with AI", write your custom instructions in Persian, and click "Build Smart Parameters".
Step 6: Add Container and Analyzer Nodes (If Using Telegram)
For comprehensive data and conversation analysis:
Add Container Node
• From the right-hand menu, click Container Node• Click the node and enter a title, e.g., کانتینر گزارشها (Reports Container)
Add Container Node
• From the right-hand menu, click Container Node• Click the node and enter a title, e.g., کانتینر گزارشها (Reports Container)• Place all previous nodes (Google Sheets, File Database, Google Docs, Vector Database, AI Assistant, Telegram) inside the Container
For Assistant Messages:
You are an AI assistant tasked with comprehensive analysis of managerial reports based on assistant messages.
Your goal is to analyze performance data to produce key metrics and periodic reports.
Required Actions and Analyses:
    • Key Metrics: Team performance (e.g., marketing ROI, project progress).
    • Periodic Trends: Changes in metrics over past weeks/months.
    • Issues and Bottlenecks: Identify problems (e.g., declining sales or project delays).
    • Strategic Recommendations: Solutions for improvement (e.g., adjusting marketing strategies).
Step 7: Connect to the Frame Chat Node
This step enables delivering AI Assistant responses via an interactive chat frame on your website or app, with testing capabilities:
Basic Configuration
•Add Frame Chat Node from right-hand menuEnter title, e.g., Feedback FrameSet company name (e.g., Delaverse)
Domain & Style Configuration
•Domain & Style Configuration
Implementation & Testing
• Connect AI Assistant to Frame Chat• Go to Code tab and copy HTML code• Use Test Frame to preview responses
Testing and Verification
• After connecting to the AI Assistant, a Test Frame option appears• Enter sample queries to review responses• Ensure responses are accurate, professional, and aligned with input data• Click Save Changes to persist all settings
Step 8: Add the Trigger Node
To automate the initiation of your financial analysis and forecasting workflow with precise timing:
Add Node:
•From the right-hand menu, click Trigger Node and drag it onto the canvas in the Delaverse Playground.
Configure Node:
Click the node and enter a title, e.g., “تریگر گزارشگیری مدیریت” (Management Reporting and Analysis Trigger).

Timing Settings: In the “Timing Settings” section, choose the scheduling type from the dropdown:

  • Interval: Select a value and unit (e.g., 1 day) for regular execution, and set the timezone (e.g., Asia/Tehran).
  • Cron Expression: Enter a Cron pattern, e.g., “0 8 * * *” for daily at 8 AM, following the provided example.
Message Text: Enter “مطابق دستورالعمل، عمل کن” (Act per instructions) to guide the AI Assistant Node in executing the workflow’s analysis and reporting tasks.

Maximum Executions: Leave blank for unlimited runs or enter a number (e.g., 10) to cap executions.

Trigger Status: Toggle the status button to “On” to activate the trigger.

Status Info: After setup, review execution history (e.g., runs completed) and click “Update Schedule” if timing changes are needed.
Connect Nodes:
• Connect the Trigger Node’s output to the AI Assistant Node’s input to initiate the workflow.
Test the Trigger
• Configure timing and message text, then click “Test Trigger” to simulate a workflow run. Verify outputs appear in Telegram, Google Sheets, or Google Docs, depending on your setup.
Save Changes:
• Click “Save Changes” to apply all configurations, then close the editor with the top-left “X” button to return to the Playground.
Why It’s Needed
• The Trigger Node automates the start of non-API workflows,working with the AI Assistant Node to initiate the workflow.
Key Tips for Success
Training Content: Use real data (e.g., sales KPIs, team reports)
Persian Language: Keep all settings and outputs in Persian
Testing: Verify reports in Telegram, Google Sheets, or Google Docs
Continuous Saving: Click Save Changes after every modification
Periodicity: For weekly/monthly reports, configure nodes to run automatically in the Playground settings
Final Output
Performance data is collected from Google Sheets, File Database, or Google Docs
Summary and analytical reports (key metrics, trends, issues, recommendations) are generated
Reports are delivered via Telegram (text responses), Google Sheets (tables), or Google Docs (text reports)
Periodic trends and key metrics are provided through the Comprehensive Insights Node
General Note on Workflow Customization This workflow, like all workflows in Delaverse’s knowledge base, is designed as a sample for educational purposes. Users can extensively customize nodes, settings, and input files to meet personal or organizational needs. For assistance, consult our 24/7 support chatbot or submit a ticket for guidance. If you’re unable to build or modify the workflow yourself, request professional workflow creation via a ticket; we’ll provide a cost invoice based on your subscription level, and after payment, we’ll collaborate to build it. For new node development (e.g., a custom node not yet available), submit a ticket with your requirements, noting that such requests may incur higher costs due to development efforts. Our team is here to ensure your automation success! 😊
Ready to Transform Your Management Reporting?
Start building your intelligent automated management reporting workflow today. Collect performance data from multiple sources, generate comprehensive analytical reports, and deliver strategic insights to executives and managers with AI-powered analytics that drive informed decision-making.